On 3rd down on offense, we are very efficient in short yardage situations and well above the college average. Conversely, in thirds and long, we struggle. I think this confirms many fans complaints about Porter’s willingness and/or ability to throw the ball downfield. It would be interesting to break out Ryan and Porter’s efficiency numbers separately.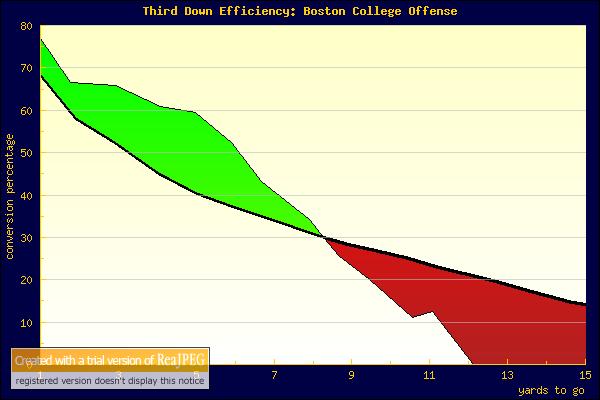
We took more risks on defense this year and I think it shows. Our short yardage numbers are very strong as well as our third and very long. However, the third and 9 through third and 11 are below average. So much for bend but don’t break.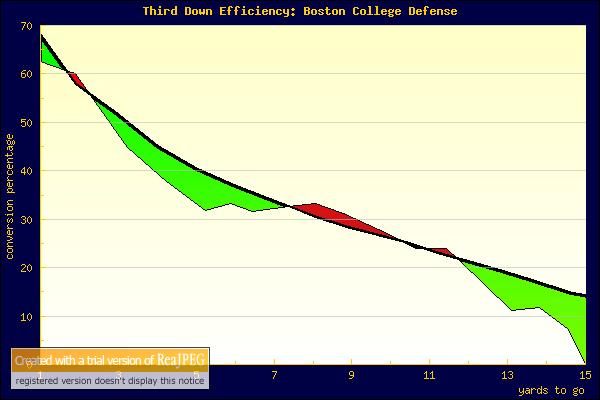
This is the distribution of our 3rd downs. According to the data we had more third and shorts than the average college offense. We also had fewer third and longs. This sort of speaks to my belief that Bible is better than most people give him credit for.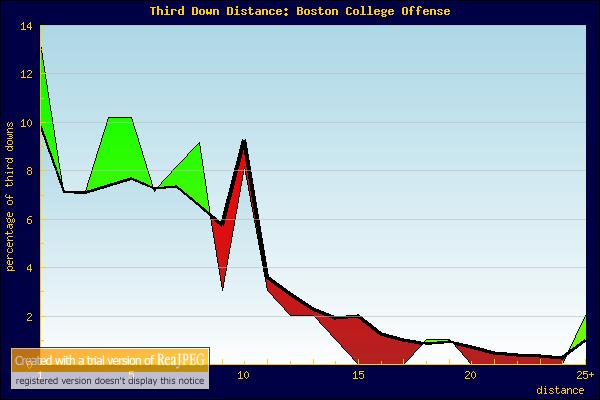
Defensively the distribution is a little more scattered. We are in fewer third and short situations, which is good. In turn this means that we defend more third and long situations. I guess this speaks to our strong run performance last year.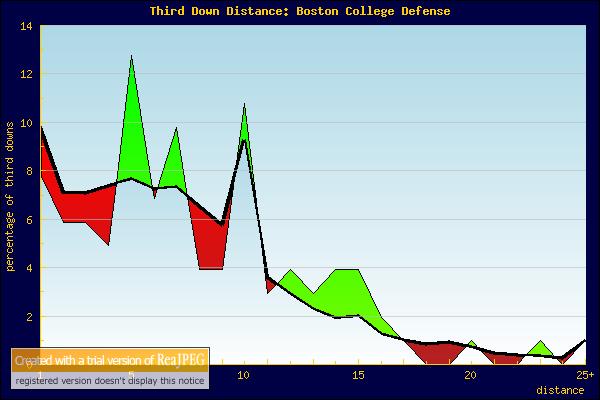
This final graphs is the raw numbers on offense Brian used to calculate this stuff. Please go to his blog to check out more cool stuff and analysis.


No comments:
Post a Comment